


March 12, 2014 - EEMUA 191 Revision 3 has revised requirements in terms of generating and representing KPIs. Alarm Management professionals and engineers responsible for control systems on process plants should therefore be aware of these changes and how to interpret them, says Bruce Nicolson, Senior Control Systems Engineer at Intelligent Plant. On the 11th of September 2013 the 3rd Revision of EEMUA’s (Engineering Equipment & Materials Users’ Association) highly influential “Alarm Systems, a guide to Design, Management and Procurement” was released at a seminar in Manchester. This revision has revised requirements in terms of generating and representing Key Performance Indicators (KPIs). This article explores what those changes are and how the visualisations are affected.
Alarm Management professionals should be aware of these changes and how to interpret them. Users can verify the visualisations with a small set of their own data by visiting: http://www.intelligentplant.com/Pages/Distinguish.aspx or by using Intelligent Plant’s Alarm Analysis.
Performance Level by State
From section 6.5.1: “As noted above, there are two separate alarm situations that define the overall performance of the system:
- Plant in Steady State operation
- Plant in Abnormal/Upset condition
Mechanisms for improving performance in these two situations do differ and it is undoubtedly the abnormal situation that is the harder to address.” “It is sensible therefore to consider performance levels relating to the KPIs for each situation separately”. The Steady State is measured by the mean average alarm rate per 10 minutes, and displayed in a simple diagram where the alarm system state is indicated: 
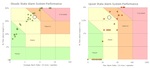 Figure 1 – Steady State Performance Level Similarly, the Upset State can be measured by taking the maximum 10-minute period per day and averaging it over the month:
Figure 2 – Upset State Performance Level This KPI is usually displayed in the KPI table, but there is now context as to what this means and how much it needs to change. System Performance by State EEMUA 191 Rev 2 defined a grid used to determine an alarm system’s performance:
 Figure 3 – Performance State Scatter Charts In Rev 3 this grid has been considerably redefined to better cater for steady and upset behaviour:
Figure 4 – Revised Performance State Scatter Charts The same underlying alarm data is used for both pairs of grids. As well as an overall monthly average, daily values are plotted to give a feel for the range of behaviour that the system exhibits. Two charts are used instead of one to make the pattern of the daily values clearer. There are now four levels of behaviour compared with the previous five, so for this data the classification goes from mostly robust to stable. This needs to be taken into account if comparing current performance with that documented in the past; it will only be meaningful if the past performance is measured in the same way.
The steady state scatter chart appears to follow a definite arc. This makes sense because as the average alarm rate rises, so will the % time above the target of 1 alarm per 10 minutes. It should also be noted that in the Upset chart, the first column can only have scatters along the bottom line. This is because the maximum alarm rate is less than the target of 10 alarms per 10 minutes, therefore there is 0% of time above 10 alarms per 10 minutes.
Conclusions
EEMUA 191 rev 3 redefines both the calculation and visualisation of Alarm System KPIs to give more accurate results in a more useful format. Engineers responsible for control systems on process plants should be aware of these changes and apply them as soon as possible to their systems.
About Intelligent Plant
Founded in 2006, Intelligent Plant is an independent consultancy, software integrator and developer based in Aberdeen, UK. Intelligent Plant is an ISO 9001 registered company that is focused on providing services and solutions to the oil and gas industry. The company specialises in the performance monitoring of equipment and processes through analysis and visualisation of real-time data, and in the management of alarm data. With a multi-discipline team of engineers and software developers, this allows the company to approach problems from both engineering and IT perspectives.
Intelligent Plant offers a variety of services, including: Real-time data applications; Software integration services; Alarm management services; Mathematical modelling; Process graphics; Legacy control system configuration and support; Installation, troubleshooting and support of Modbus and OPC systems.
