


Decades ago, Lean and Six Sigma laid the groundwork for continuous improvement methodologies in the process and discrete manufacturing industries. Much like the process operations that Lean and Six Sigma have been applied to, the methodologies themselves have also been continuously improving. Industry 4.0 and data science innovations—machine learning, big data, cloud computing, etc. —have played the largest role of late, expanding analytic capabilities well beyond their historical limits.
While the type of processes which can be improved have increased and some terminology has changed, the methodology behind approaching any one of these projects, or use cases, remains constant. The improvement project framework of define, measure, analyze, improve, control (commonly referred to as DMAIC) is a hallmark of Six Sigma and has become the standard across all manufacturing industries since its introduction last century. It describes a data-driven process improvement cycle that has most frequently been applied by certified Six Sigma Black Belts to solve well-defined process optimization problems. This approach often resulted in organizational and data silos, but these are beginning to break down, thanks to new technologies enabling the democratization of data across organizations.
Self-service advanced analytics applications are creating an army of front-line DMAIC practitioners, using advanced statistical concepts to solve problems, without a Black Belt or a PhD required.
Leaning into digital lean
The terms Lean Manufacturing and Six Sigma are often taken together and used interchangeably, and the same holds true for their new and improved digital versions. Together, they have provided organizations with an arsenal of process improvement project frameworks for maximizing product quality and uptime—while reducing waste, inventory, and energy input. Advanced analytics applications are expanding the toolsets by which these methodologies are applied, broadening their application to include previously unsolvable use cases. Intentional or not, the Six Sigma DMAIC process has directly shaped the capabilities built into modern time series analytics software applications.
Much of the process improvement work being done today follows a less regimented version of the DMAIC workflow, enabling flexibility and agility in objectives and approaches, often fully contained within a single software application. Web-based advanced analytics applications are empowering process engineers, shift supervisors and other experienced process subject matter experts (SMEs) to:
-
Define and document project or use case background, challenges, and success criteria.
-
Identify measured variables and contextual information necessary to solve the problem via a live connection to the system of record for all data.
-
Analyze the relevant data in the context of data from other sources. Calculate key process indications (KPIs) and targets from historical data. Identify anomalous system behaviors and create predictive models to forewarn of production, quality, reliability, environmental, or other issues.
-
Apply the resulting models, calculations, or monitoring techniques to data outside of the training data set and improve the methods. Cleanse data, adjust input parameters, or tailor prediction techniques based on mode of operation.
-
Operationalize insights and empower front-line personnel to make proactive process adjustments to control product quality, throughput rates, and equipment performance.
Despite a wide range of product and process types, the process improvement objectives defined by manufacturing companies generally fall into areas to be maximized: product quality, uptime and throughput, equipment reliability, and those that should be minimized: energy consumption, waste, work in process, and inventory. While optimizing all these areas would create the perfect process, a more realistic approach focuses on one or two related objectives to generate tangible busines value by leveraging existing resources. A thorough understanding of the problem to be solved must be accompanied by knowledge of the data required to analyze the problem, specifically, the measured and manipulated parameters, along with time periods of interest.
Defining these objectives in an iterative and collaborative environment is key.
Reducing time to insight
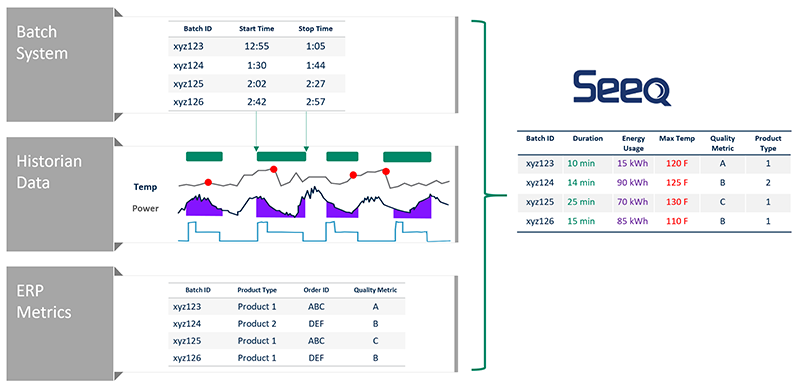
A critical first step in data driven problem solving is identifying the data required, where it is stored, and how it is accessed. This task has been eased by advances in technology that have eliminated the need for spreadsheets as a tool for collecting static ranges of data queried from multiple databases. Modern advanced analytics applications connect directly to the system of record, updating datasets as new samples roll in, and overlaying high frequency process data with low frequency laboratory, contextual event, and other data (Figure 1). Advances in data handling and computational capabilities provide the ability to analyze as many samples as are needed, instead of being limited by the allowed samples as rows in a spreadsheet.
 Perhaps the most notable workflow efficiency of this approach is the speed at which SMEs are converting information into insight. Complex data analysis techniques have become increasingly accessible thanks to software applications with no-code or low-code user interfaces for performing calculations. Visualizing data, detecting events, cleansing signals, performing statistical calculations, and multivariate modeling has never been easier, or faster. The simplest and the most complex analyses of time series manufacturing data both begin by selecting a subset of the data. Users must identify pre-defined time ranges, unique operating modes, patterns in a trend, batch or procedural sequences, operating limit deviations, or any combination of these and other events.
Advanced analytics applications enable rapid detection of these events, and the creation of visual representations overlaying events of interest or displaying events end-to-end. Calculating statistical limits, creating golden profiles, aggregating periodic KPIs, and building advanced regression models can now be done in a point-and-click manner, with no advanced statistics background or programming skills required. When a use case warrants more advanced machine learning (ML) and artificial intelligence (AI) algorithms, these applications can be extended to harness the power of Python or other programming languages.
Iteration and collaboration
In any data driven operational excellence project, the improvement and control phases are iterative. The initial deployment of an analytical model or other process improvement project is validated and improved by testing against historical and incoming data sets. This testing is most effective when performed on a sample of assets that represent each of the unique equipment or operating parameters of the process. SME participation is critical at this step to ensure appropriate test data sets and weeds out one-off events. A collaborative tool for sharing results and documenting findings with colleagues ensures more expert touchpoints and lowers the likelihood that something will be missed.
Process experts may suggest tweaking certain parameters or incorporating additional scenarios in the model training data. With the relevant stakeholder feedback incorporated, the improved project is ready for a wider deployment. The ability to operationalize the results of an analysis differentiates near-real time monitoring and predictive analytics from historical data analysis. This requires advanced analytics software with a live and performant connection to the necessary data sources. SME knowledge gained from these analyses paint a detailed picture of current performance versus historical and current constraints.
These results can inform near-real-time process adjustments to achieve the business objectives of maximizing quality, throughput, and reliability—while minimizing inventory, energy consumption and waste.
Use cases highlight synergies
Use Case 1: Product Quality Modeling
A large petrochemical manufacturer was experiencing challenges controlling product quality within a desired range, resulting in product downgrades and wasted raw materials. They combined the DMAIC process improvement methodology with Seeq, a self-service advanced analytics application, to implement a new product quality control strategy using predictive modeling capabilities. The solution saved one production line $500k per year in margin loss from product downgrades from high quality to low quality and scrap products.
-
Define – Process SMEs identified the data necessary to perform this analysis, along with the time range comprising a historical dataset representing multiple modes of operation and product types. They defined success criteria as a significant improvement in product quality downgrades by deploying a product quality model to prescribe proactive adjustments in place of the existing lab-based feedback control procedure.
-
Measure – A live connection to the source databases was established using Seeq’s out-of-the-box connectors to the process data historian and laboratory information management systems to provide real-time visualization. By using unmanipulated source data, they ensured that no features would be ignored because of down sampling or aggregation.
-
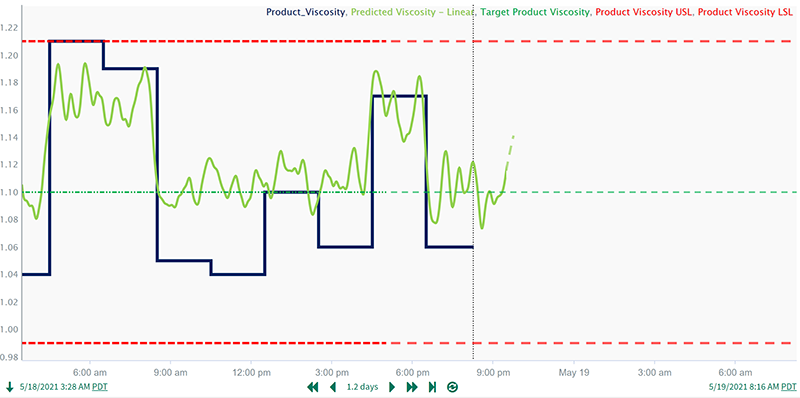
Analyze – The raw process signals were cleansed, time-delayed, and overlaid with the product quality data. A regression model of the quality parameter was built using the delayed process signals. The model gave operations and engineering insight into what the product quality result would be, an entire residence time before the sample was taken for the measured test (Figure 2).
-
Improve – A high alert rate was observed when comparing current operational to the theoretical ideal timing of events based on the procedure. The decision was made to instead build an ideal profile based on the procedural flow, combined with the best historical performance foreach procedural step. A golden profile for a CIP cycle was developed, and training was conducted to show operators how to use the tools developed to track CIP cycle performance against best case profiles, and to act accordingly when something appeared to be behaving abnormally.
-
Control – The solution has been deployed to operations for near-real-time monitoring of CIP cycles. A red capsule is displayed any time the beginning of an overcleaning event is detected, prompting operations to make an immediate process adjustment to minimize the amount of wasted time and resources. This solution provided improved insight into process losses, empowering the operations and engineering teams to cut CIP materials and utilities losses by 67%, while realizing time savings equivalent to one extra product batch per month
Use Case 2. Clean in Place (CIP) Cycle Optimization
CIP cycles between product campaigns were a leading production constraint for a major pharmaceutical manufacturer. It was suspected that inconsistencies in procedural steps were resulting in wasted water and cleaning chemical, along with excessive process delays. Combining Lean Six Sigma techniques with the appropriate data and analytics toolset, the manufacturer was able to identify inconsistencies, quantify materials and time losses, and deploy a solution that provided recommendations when future losses were detected.
-
Define – Process SMEs identified the procedural steps most prone to overcleaning as the focus for the early stages of this analysis. They identified the process and event data required, and they decided the results of the analysis should be reported both on a per event and annual basis. Improvements in time and raw material losses of greater than 50% per year would indicate project success.
-
Measure – Live connections to the process data historian and events database were made. Since the clean in place events were short in magnitude relative to production batches, it was critical to analyze the raw data without any down-sampling, aggregation, or compression.
- Analyze – SME knowledge and procedures documenting the theoretical ideal CIP cycle were compared with historical data to determine how often deviations from procedural instructions were occurring.
The magnitude of the losses caused by these deviations was quantified on a per event and annual basis.
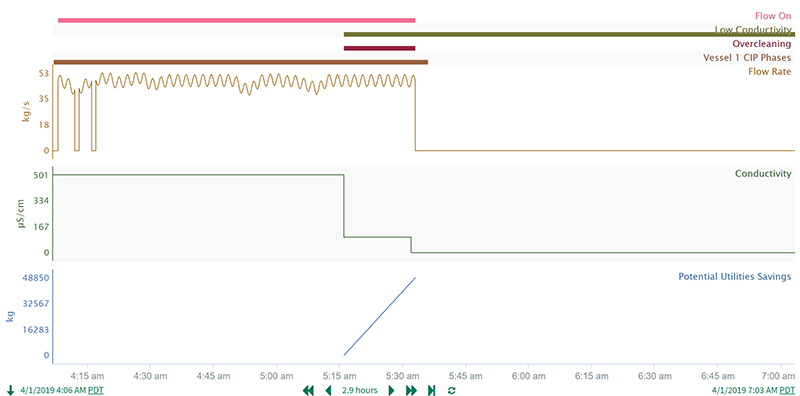
Conditions were put in place to inform operations when a prolonged deviation from the CIP procedure was occurring (Figure 3).
-
Improve – The model performance was evaluated using historical data outside of the training dataset, and it was discovered that the model performed poorly for a couple of infrequently run product types. The decision was made to produce a series of product specific models, and stitch these together into a single final model for deployment.
- Control – The online model, combined with the expertise of front-line operators and engineers, resulted in adoption of a new and improved control methodology for this product quality parameter.
Rather than waiting on the results of a lab test for hours, operators seeing a predicted low-quality result were empowered to investigate, act, and evaluate the results of their actions on the quality prediction.
Conclusion
Lean and Six Sigma projects have served the process industries well for decades, but new tools are needed to optimize outcomes. Advanced analytics software is particularly well suited to these types of projects, providing the benefits desired with much less time and effort as compared to traditional technologies.
