
Brownfield paper machines generate large volumes of quality control system (QCS) and distributed control system (DCS) data, yet many teams still spend hours reconstructing what happened after breaks, slow grade changes and quality excursions. This article presents a control-safe, practitioner-ready blueprint for converting existing automation data into repeatable actions: read-only extraction from the QCS or DCS into a historian with edge buffering, a curated context layer that links time-series data to grade and reel or roll identifiers plus event windows, and a small set of role-based views that fit daily operations. Three high-frequency use cases — downtime loss visibility, grade-change stabilization and quality-loss mapping — are described with design tips, target metrics and reliability workflow hooks. An anonymized brownfield project example and submission-ready figure guidance show how to govern definitions, protect control integrity and replicate the approach across machines.
After reading this article, you will be able to:
- Design a control-safe operational technology data pathway from the QCS or DCS into the historian and/or the plant-floor edge analytics.
- Build an ISA-95-inspired asset and tag model that scales and remains usable through upgrades.
- Embed analytics output into routines and work processes so insights consistently become verified actions.
Key insights
- In many mills, a meaningful share of lost production hides in unknown downtime, inconsistent transitions and slow quality triage; the fastest wins come from making these losses measurable and repeatable.
- It is important to start with read-only data extraction (one-way data flow from the QCS or DCS to the historian or edge). Keep the control system as the system of record, and do not write back to the Level 2 control layer until a separate, tested advisory phase is approved. You must earn trust before attempting advisory or optimization functions.
- Edge buffering plus consistent definitions (a KPI register) make event timelines credible.
- A small, clean set of top 100 tags plus clear ownership will scale better than a massive uncontrolled tag dump.
- Dashboards must be embedded in daily and weekly routines with named owners and a follow-up path (e.g., shift review → assign owner → open reliability ticket/work order → verify closure); otherwise, they become wall art.
Why more data isn't the answer
Paper machines already generate data across systems: QCS profiles, DCS loop values, drive signals (speed, torque and load), utilities metering, lab results and operator actions captured as events (manual overrides, acknowledgments and shift notes). Yet when a break repeats, a grade change drifts or moisture swings, teams often fall back to time-consuming reconstruction: What happened first? Which section changed? Was this a control response, an instrument issue or a mechanical disturbance? That delay is expensive.
In one anonymized brownfield implementation discussed later (see “Project example: Anonymized brownfield implementation”), the team reduced unknown downtime from 40% to 14%, cut a targeted grade-pair time-to-stable from 12 minutes to 6 minutes and shortened repeat-break diagnosis time by more than 40%. Those results did not come from collecting more tags; they came from making events comparable, attaching evidence automatically and running the same follow-up routine every week.
Practical rule of thumb in continuous-process operations. It is not unusual to see single-digit to low-teens percentages of production opportunity impacted by a mix of unclassified downtime, transition losses and slow-to-diagnose quality events. The aim of a brownfield digital program is not to chase AI everywhere. It is to cut time-to-action and increase the percentage of issues that are diagnosed the same way every time without jeopardizing control stability.
A control-safe brownfield digital architecture
The five-step pattern below was framed using the Purdue Model for ICS security (Purdue Enterprise Reference Architecture).
- Source (Levels 1 and 2): DCS and QCS remain the system of record for control.
- Collection (Level 3): Historian ingestion from QCS or DCS should use read-only interfaces.
- Resilience: Implement edge buffer or store-and-forward processes so outages do not break event timelines.
- Context layer (Levels 3.5 and 4): This layer includes models that attach grade and recipe information, reel (machine) and roll (winder) IDs, downtime segments, breaks and off-spec windows to time-series data.
- Consumption: This consists of role-based views feeding routines and reliability workflows.
Design tip. Put the read-only boundary in writing. Start with extraction only. Any future advisory or optimization functions should be separate phases with formal testing, rollback plans and clear safety limits.
Best practice. Segment for defense-in-depth. Place historians and analytics in the Level 3.5 and 4 zones (often called an industrial demilitarized zone [DMZ]) and minimize pathways back into Level 2 control. Log access, enforce least privilege and keep backups and patching disciplined.
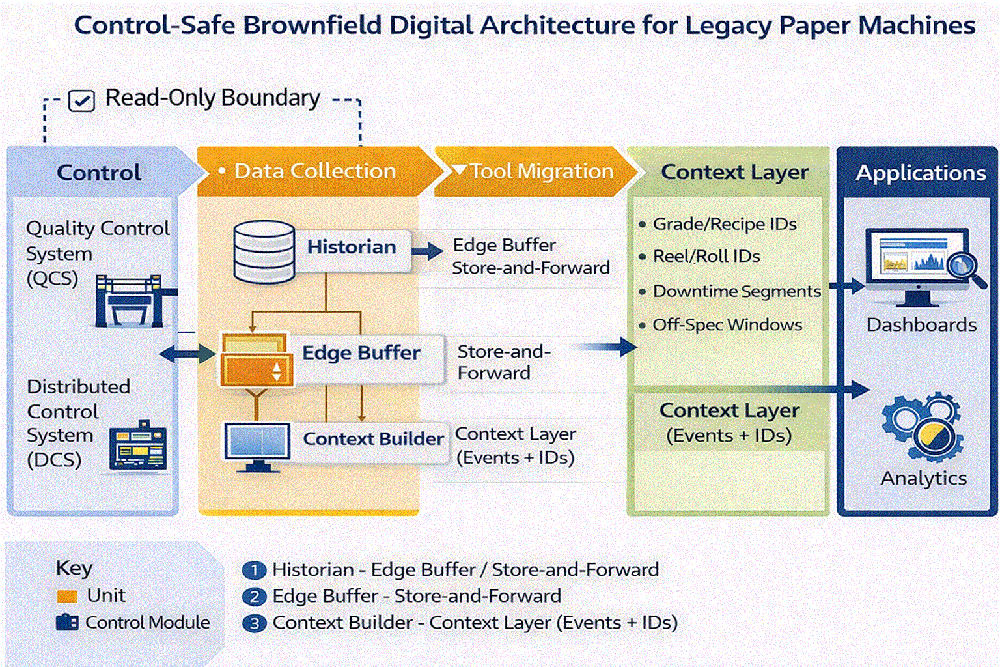 Figure 1: Control-safe brownfield digital architecture for legacy paper machines.
The asset and tag model: Make it scalable on day one
Most brownfield initiatives fail quietly: They ingest thousands of tags, publish a few dashboards, then watch definitions and signals drift until users stop trusting them. Scale requires structure. Start with an ISA-95-inspired hierarchy that matches how the mill runs: enterprise to site to area (stock prep, paper machine and utilities) to unit (approach flow, headbox, forming, press, dryer, calender and reel or winder) to equipment and control modules. Then, define a lightweight data contract for every high-value tag: what it is, where it is, what it influences, units and scaling, engineering limits and expected band, source system and timestamp basis, and the owner who approves changes
Here are a few sample naming conventions for tags. These can be adapted to your plant standards, but the key is to be consistent. Figure 2 provides the metadata for PM1.HEADBOX.PRESSURE.PV.
- PM1.HEADBOX.PRESSURE.PV
- PM1.DRYER.STEAMHDR.PRESSURE.PV
- PM1.REEL.TENSION.SP
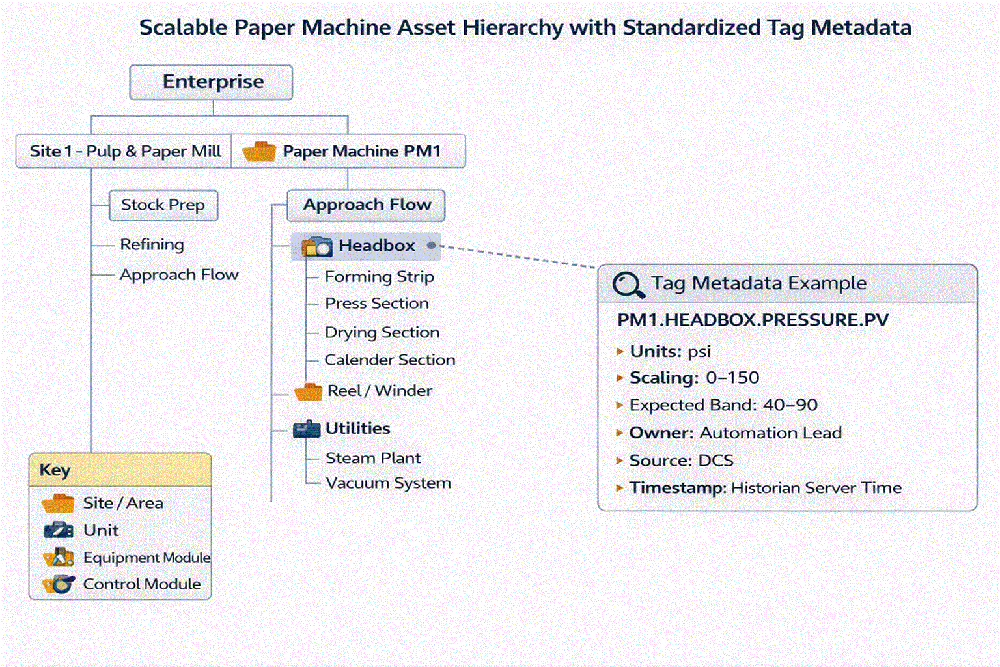 Figure 2: Scalable paper machine asset hierarchy with standardized tag metadata.
Data quality: Handling time, units and invalid data
Credibility must be engineered to ensure a smooth process. For example, if time alignment is uncertain, every post-event review becomes an argument. The following are recommendations for processing and verifying data to ensure that it is credible.
Time sync. Use Network Time Protocol (NTP) as a minimum; consider Precision Time Protocol (PTP) where sub-second alignment matters (e.g., high-speed break analysis). Validate offsets between QCS, DCS, historians and gateways during commissioning and after infrastructure changes. Include a visible time-quality indicator for the dataset used by dashboards.
Units and scaling. Verify the engineering units and scaling for the top 100 tags before publishing the KPIs. Document the sampling rates and filtering so users understand why trends appear flat or noisy. Add simple, out-of-range checks to catch swapped scaling early.
Invalid data flags. Flag periods when sensors are in calibration, out of range, failed or bypassed. Where possible, surface good, bad and uncertain quality flags in the view so operators do not chase bad data.
|
Example definition (keep stable) |
|
|
Downtime event |
Stop ≥ 60 s; segmented by speed threshold and line state |
|
Unknown downtime |
Coded as unknown or unclassified after the operator prompt window |
|
Grade-change start |
Recipe or grade ID change confirmed and speed ramp start |
|
Time-to-stable |
Key quality variables within grade-dependent bands for ≥ 5 min |
|
Off-spec window |
Quality variable outside limit for ≥ 2 min (excluding planned transition window) |
Table 1: KPI register.
Three use cases that convert visibility into action
The best early use cases share three traits: frequent events, measurable outcomes and clear ownership.
Use case 1: Downtime loss visibility. Build a downtime loss view that shrinks unknown losses: a reason-code structure aligned with the plant’s approach to resolving problems, a Pareto by section and grade, and an evidence bundle (speed profile, top alarms, section indicators, etc.) for significant stops.
Examples of target metrics include:
- Reducing unknown downtime from approximately 40% to less than 15% within 8 to 12 weeks.
- Cutting average time-to-diagnose repeat breaks by 30% to 50%.
Here is an example of a reliability hook:
- Auto-create a reliability ticket when a downtime code repeats N times in a week or exceeds a duration threshold, and attach the evidence bundle.
Use case 2: Grade-change stabilization. Treat grade changes as a repeatable process. Build an annotated timeline with milestones (start trigger, recipe switch, speed ramp, stabilization, etc.), an event rail (setpoint changes, overrides, alarms, etc.) and a scorecard (time-to-stable, excursions, off-spec, alarm counts, override minutes, etc.).
Examples of target metrics include:
- Reducing average time-to-stable from approximately 12 minutes to less than 6 minutes on targeted grade pairs.
- Reducing off-spec product produced during transitions by 20% to 40%.
 Figure 3: Example grade-change annotated timeline (milestones, event rail and evidence bundle).
Use case 3: Quality loss mapping. Treat quality deviations as event windows with pre- and post-context. Start with one or two trusted metrics; apply exclusions for planned transitions and group events by signature and contributing section (wet end, press, dryer steam or condensate, calender, reel, etc.).
Examples of target metrics include:
- Cutting repeat quality events of the same signature by 25% to 40% over a quarter.
- Reducing time-to-restore after a quality excursion by 20% to 30%.
Governance and cybersecurity without paralysis
Momentum requires ownership and small rules that prevent drift. Assign an automation owner (tag integrity and control boundary), an operations owner (definitions and adoption), a reliability owner (work translation and verification) and a definition keeper (KPI register). Document the asset model and KPI definitions so new staff can sustain the system.
Keep cybersecurity practical. Implement Purdue-style segmentation with historians or analytics at Levels 3.5 and 4, least privilege, audited access and disciplined backup and patch routines.
Phased rollout plan (and the replication test)
- Phase 0 - Credibility: Time sync checks, unit and scaling validation, top 100 tags and a KPI register
- Phase 1 - First win: One operator-usable view (often downtime) plus a weekly review routine
- Phase 2 - Context: Grade, reel and roll IDs, event capture, minimal notes and a second use case
- Phase 3 - Reliability integration: Ticket and work-order hooks, signature cards and impact tracking
- Phase 4 - Replication: Applying the same model on a sister machine or another area with minimal rework
Replication is the test. If you must redesign everything for the next line, you built a one-off dashboard, not a scalable system.
Project example: Anonymized brownfield implementation
A legacy paper machine had QCS and DCS data available, but downtime coding was inconsistent, grade changes varied widely by crew and post-event investigations were slow because context was scattered across systems. The first step was establishing credibility: time synchronization checks, unit and scaling validation for the initial tag set and flags for invalid periods. A short KPI register was agreed upon across shifts to measure events consistently.
The team implemented historian ingestion with edge buffering and created a context layer for grade IDs, reel and roll IDs, downtime segments, breaks and off-spec windows. Deployment started with a downtime loss view that only required reason codes above a threshold and automatically attached evidence bundles. Within weeks, unknown downtime shrank and repeat patterns became visible enough to assign owners and corrective actions.
Next, a grade-change timeline was introduced with agreed-upon milestones and a realistic time-to-stable definition. Comparisons for the same grade pair across shifts highlighted inconsistent sequence timing and manual overrides. A short list of standard practices was created, and performance was verified against a golden change baseline.
Finally, quality events were mapped and grouped by signature (e.g., steam and condensate instability patterns). Outputs were routed into targeted inspections and follow-up checks, and repeat events were used to justify preventive work. After the initial success, the same model was replicated on a sister machine.
|
Metric |
Baseline |
Post-implementation |
Improvement |
|
% Unknown downtime |
40% |
14% |
-26 pts |
|
Avg time-to-diagnose repeat breaks |
120 min |
70 min |
-42% |
|
Avg time-to-stable on target grade pair |
12 min |
6 min |
-50% |
Table 2: Anonymized results from brownfield architecture implementation on a legacy paper machine.
Lessons learned
- Time sync issues create arguments, not improvements.
- A small, clean tag set beats a massive uncontrolled tag dump.
- Definitions matter more than visuals; lock them in early and keep them stable.
- Dashboards without routines become wall art; routines without data become opinions.
- Adoption is engineered and consists of simple views, consistent screens and impact-confirmed follow-up.
Conclusion
A successful brownfield digital program is intentionally boring: stable boundaries, clean definitions, disciplined modeling and small releases that become habits. If the system helps teams agree on what happened, decide what to do next and verify the impact week after week, it stops being a digital project and becomes part of how the mill runs. Start with establishing credibility: ship one high-impact use case, embed it in routines and prove it can be replicated. The combination of control-safe architecture plus action-verified follow-up converts data into sustained performance.