




Companies invest in smart manufacturing technology, the technology works, yet the operational results still disappoint. Pilots succeed in controlled conditions and then quietly fade when the dedicated team moves on. Projects deliver dashboards that nobody uses. Investments that looked solid on paper produce no measurable change in how the plant actually runs.
In continuous process manufacturing — with paper machines, rolling mills, extrusion lines and coating lines — consistent patterns like these repeat themselves in digital transformation programs. I have worked in these environments for over two decades. A recent CESMII annual workshop on smart manufacturing helped me put into words why this keeps happening. I am writing this for engineers and operations leaders who have been in discussions about how the technology worked, but the result still did not land. May my takeaways be your lessons.
Takeaway 1: We describe our work in technology terms, and that is a problem
Ask a room of automation engineers to write down the digital work they are most proud of in the past year. They will describe technology: OEE (overall equipment effectiveness) dashboards, predictive maintenance tools, vision inspection systems, OPC UA (Unified Architecture) implementations, robotic material handling, closed-loop process control. The list will be technically impressive. Almost nothing on it will describe a business result.
This is not a communication problem; it is a structural problem. Engineers are trained to solve technical problems. Their natural language is technology — implementations, deployments and configurations. Most companies never explicitly ask them to connect that work to a business outcome: Did throughput improve on that line? Did the quality excursion rate drop? Did we recover margin? So, engineers do not make that connection — not because they are unable to, but because no one has built it into how their work is defined or measured.
Multiple industry surveys point to a consistent pattern: Many pilots get funded, but far fewer become sustained operational capability. Deloitte found that while 80-85% of manufacturers surveyed had invested in smart manufacturing use cases, only 24-36% were able to operationalize them. LNS Research found that only 5% of manufacturers pursuing digital transformation reported full success, while 17% were stuck in the pilot phase with unclear results.
In continuous sheet manufacturing, this pattern takes a specific form. Pilots get run in parallel with normal production — on one section of a machine, with a dedicated project team. When the pilot ends, the process keeps running with the old operating model intact. The technology might stay, but the workflow never changes. The team that understood the system moves on to the next project. Nobody owns the operational decision the system was built to support.
Consider a concrete example: if a dashboard flags a coating weight deviation on a running line, is the shift supervisor authorized to stop the machine, or does the alert sit until the morning production meeting? Without a written answer before the pilot starts, the dashboard is not a decision-support tool — it is a display.
What to do. Before any pilot begins, get written answers to three questions. If you cannot answer all three before you start, the pilot is not ready:
- What is the measurable outcome, with a defined baseline?
- Who is the named operations role responsible for acting on the insight?
- What does this pilot produce that the next one can build on?
Takeaway 2: A different mindset produces different questions on the same floor walk
Walk through a plant with a reliability engineer and the floor looks different. They hear a bearing starting to fail in a motor. They notice a section of uninsulated pipe. They see a cracked door and know from the pressure differential that conditioned air is leaking out. You walk the same floor and register none of it — not because you know less, but because they have trained themselves to ask different questions automatically.
Smart manufacturing works the same way. It is not primarily a technology program. It is a different set of questions that practitioners ask when they walk the floor.
Without the smart manufacturing lens, a paper log on the floor is evaluated for completeness. Is it filled out? Is it filed correctly? With that lens, the same log raises different questions: What decision does this data support? Does anyone actually use it? Could the collection be automated? Could the decision it supports be standardized so anyone on any shift can make it consistently? These are not harder questions to ask. They are simply not the trained default for most technical roles in manufacturing. Manufacturing has been able to embed mindset shifts before, such as quality in the 1980s, or safety in the decades after. Smart manufacturing is the next shift and it works the same way. It’s not a procedure to follow, but a habit of asking the right questions.
One observation from the workshop stayed with me. A practitioner at a large manufacturing company described relabeling their control room screens. For years the displays showed the vendor’s name. When something failed, the vendor got the blame. When the team replaced the vendor’s name with their own plant name on the screen, the conversation changed. Failures became something the team owned and investigated, rather than something they blamed on an outside vendor. A naming convention, applied consistently, shifted the culture of ownership more effectively than years of policy. A small action was actually a large signal.
In continuous sheet manufacturing, the mindset gap shows up most clearly in how historical process data is treated. When paper machines, rolling mills and coating lines generate continuous time-series records, the data sets are immense: parameter states at every operating condition; quality measurements correlated with process configuration; grade change histories; excursion records before and after an event.
In many plants, this data is retained for a compliance window and then purged on a schedule. It is purged not because it has no value, but because no organizational practice exists to ask what it could tell us.
Grade changes alone—the transition periods where product is off-spec until the process stabilizes—represent some of the highest waste events on any continuous line. The data that would reveal how to shorten that window already exists in most plants. The practice of mining it does not.
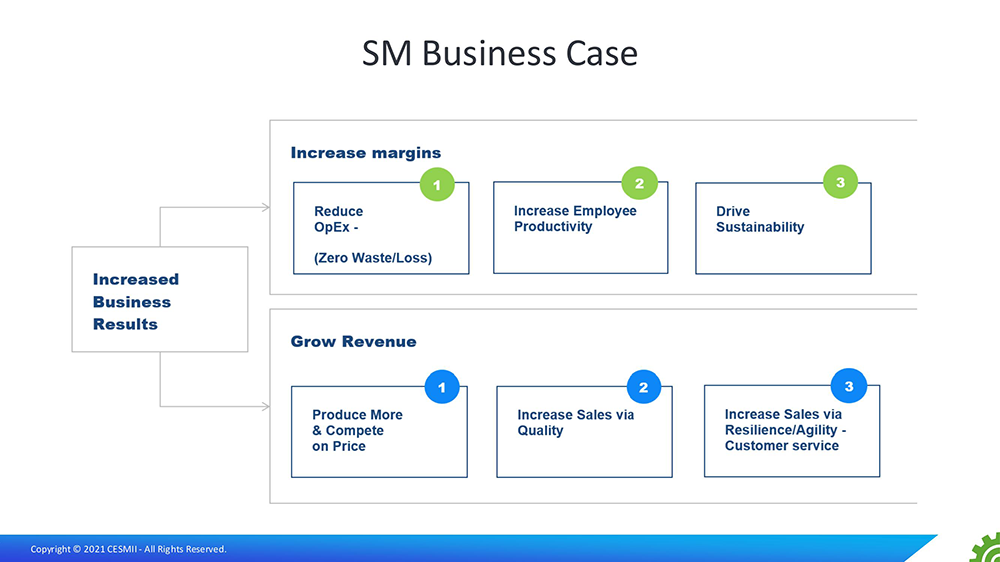 Figure 1: A smart manufacturing business case has two value levers: margin improvement and revenue enablement. Reproduced with permission from CESMII.
Takeaway 3: The business case is almost always half the size it should be
Almost every business case I have seen for a digital manufacturing investment is built around cost reduction. The initiative will reduce downtime by a projected percentage, cut scrap and lower manual labor hours. Those are real numbers but they are also incomplete, because they capture only one of two available value mechanisms and almost always assume a demand scenario that understates the opportunity.
Smart manufacturing investments move value in two directions. The first is margin improvement: reducing operational loss across scrap, rework, unplanned downtime, speed losses against rated capacity, energy waste and labor spent on manual data collection and troubleshooting. The second is revenue enablement: producing more sellable output on constrained assets, improving quality consistency in ways that protect customer relationships, building supply chain resilience that lets the plant meet commitments when conditions change.
Most business cases model only the first. Because the second is harder to calculate conservatively, engineers tend to leave it out.
The demand scenario matters more than most business cases acknowledge. Take a constrained coating line or paper machine running at full speed at a high-demand grade. If unplanned downtime on that line is reduced by four hours a month, what is that worth? When demand is flat and the line is not a bottleneck, the answer is a modest reduction in operating cost — fewer run days, less overtime, lower energy. When demand is strong and that line is the capacity constraint, the same four hours translate directly into additional sellable output and gross margin contribution. It’s the same improvement with completely different financial values. Both scenarios may be real for the same line at different points in the year.
Here’s a simple indicator of whether the mindset has shifted: When a new initiative is proposed, what is the first question in the room? If it is about cost, the culture is not there yet. If it is about which business lever this moves and by how much, the foundation has changed.
[run in head] What to do. Before commissioning a detailed financial model, three questions can establish the scale of the opportunity from existing production data. These questions take an afternoon to answer and change the nature of the conversation with leadership before the technology evaluation begins:
- What is an hour of unplanned downtime worth on this line?
- What does the current scrap and rework rate cost per production period?
- If the line is a capacity constraint and demand is strong, what is the gross margin contribution of each additional unit of output?
The prerequisite: Organizational readiness
The three observations above are about framing — how work is described, how the floor is walked, how value is calculated. But there is a prior question that most programs skip entirely: Is the organization ready to extract value from a digital investment in the first place?
A useful diagnostic is a cross-functional assessment of organizational readiness across the dimensions that most directly predict whether digital investment succeeds. The dimensions are strategy and leadership alignment, continuous improvement culture, data-driven process maturity, systems infrastructure, workforce practices and supply chain integration. What the CESMII workshop described—and what I have found consistent with experience — is that the most valuable output of such an assessment is not the average maturity score. It is the spread among functional perspectives.
When an executive team rates their plant's digital maturity significantly higher than engineering rates it, that disagreement is not noise; it is the finding. Capital gets allocated based on one perception. Work gets done in the environment described by the other. Investments made against a current state that does not yet exist tend to underperform — not because the technology failed, but because the foundation it required was not actually in place.
The assessment also surfaces a common problem: capabilities that IT has built that operations leadership does not know exist. In many organizations, the required capability is already present. Check what exists before approving new procurement.
One caution: a cross-functional assessment signals to everyone who fills it out that transformation is being seriously considered. If the findings are not acted upon — if no discussion follows and no priorities are set — the organization concludes correctly that the initiative was not genuine. That makes subsequent efforts harder. Run the assessment only when the organization is prepared to do something with what it finds.
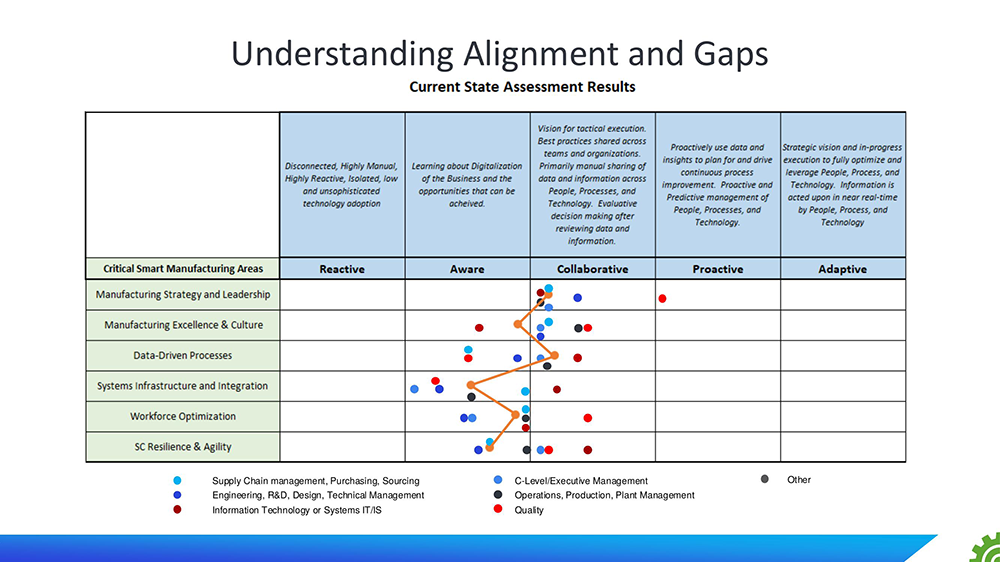 Figure 2: Understand both alignment and gaps, comparing current state maturity by functional role with target state. Reproduced with permission from CESMII.
Where to start this month
None of these takeaways require new technology, a program, a budget or a vendor conversation to act on. Defining a measurable outcome before a pilot starts costs nothing. Asking what decision a paper log supports is just a different habit on a floor walk. Modeling both value levers in a business case requires an afternoon, not a consultant.
The technology keeps improving, but the organizational practice of asking those questions first does not improve on its own. It has to be built deliberately before the pilot starts and before the vendor evaluations begin. That is the work before the work, and it is the work that most programs skip.
What to do. These five steps can begin this week:
1. Pick one chronic loss area and write the decision you want to improve in one sentence — not the technology you want to deploy, the decision you want to change.
2. Define done for the next pilot before it starts: a measurable baseline, a target, a named operations owner and the workflow change required.
3. Standardize one key performance indicator (KPI) before adding new tools to measure it. Pick one metric — unplanned downtime rate, for example — and agree on a single definition across all shifts: same start and stop criteria, same excluded events, same calculation. If shifts calculate it differently, the number cannot be trusted, and no analytics tool will fix that.
4. Walk your production floor and ask one question at each area: Is this data getting to the people who make decisions, or is it staying on the machine or on paper? Then look at where your biggest losses — downtime, scrap, quality failures — actually happen. In most plants, the two do not match. You are measuring where measurement is convenient, not where the pain is. That mismatch is where to start.
5. Before starting a pilot, decide what it will leave behind for the next one. It might be a documented alarm response procedure, a standard way of calculating a loss metric, or a defined set of equipment operating states. Without this, every pilot starts from scratch and the organization learns nothing it can reuse.
Note: This article was informed by concepts presented in a CESMII workshop by Jim Wetzel from NxGen Group and Conrad Leiva from CESMII; the interpretation and recommendations reflect the author's practitioner experience.