


A lot of papers, articles, and guides have been written over the recent years addressing Continuous Process Improvement (CPI). However very few address methodologies related to the improvement of the process itself, that is, the processing of the metrics used to measure the effectiveness of a process. The methodology proposed in this paper can be applied to any processes i.e. manufacturing, management, software development, financial, etc.
In most cases, a process is a recursive ‘series of actions’ or tasks executed in a closed loop fashion - as opposed to a linear process which is a ‘one shot deal’. A linear process cannot be subjected to the CPI. Therefore, only the recursive process will be addressed in this paper. The cycle time of a recursive process may vary greatly depending on the application. Some process cycles are very short, especially if the process is embedded in a computerized system – in order of seconds or minutes.
Other can be quite long, such as in financial and economic applications.
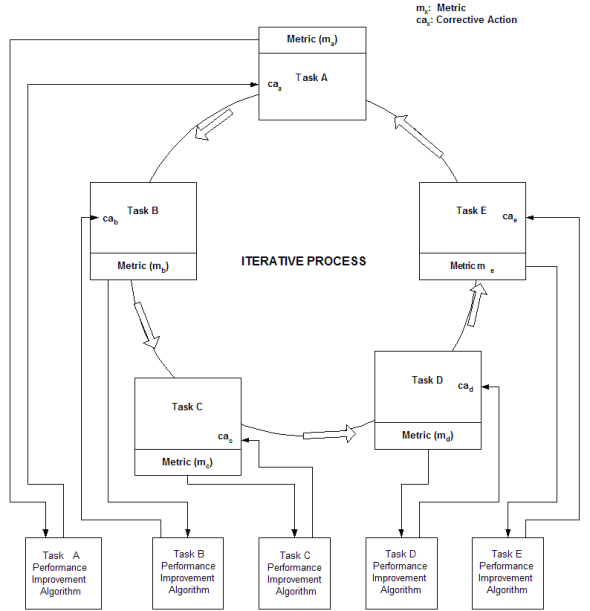
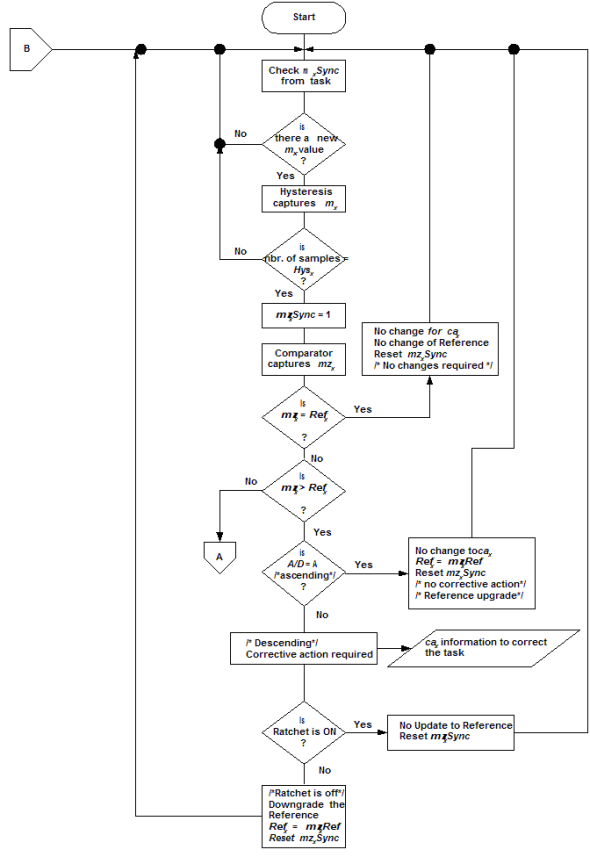
In order to assess if improvement of a process or part of a process (task) is needed, one or more metrics reflecting the performance status of a particular task, are poled periodically. The metric value is compared to the corresponding reference used as the baseline for this particular task performance. The improvement of the process or task is dependent on the result of this comparison.
- If the metric value is equal to the reference value, then no corrective in the process is required; the system is said to be stable.
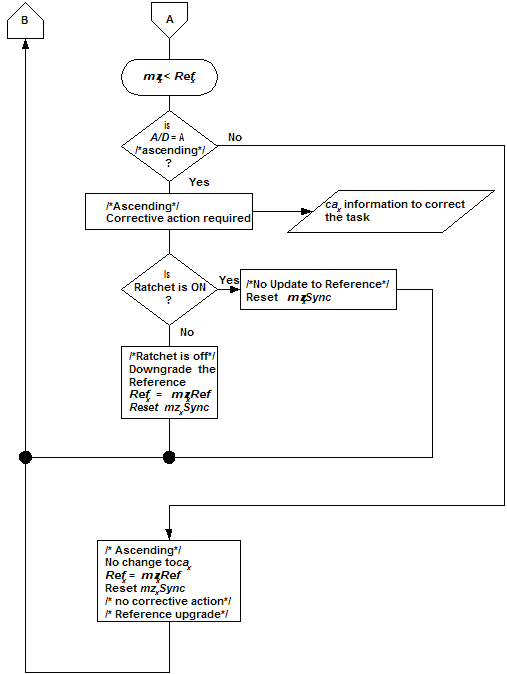
- If the performance metric valuefalls below the reference expectation, then corrective action in the process or task is required; the system is said to be below expectation.
- If the metric value exceeds the reference expectation: then no corrective action required to the process.
However, the reference value can and should be changed accordingly to reflect the new baseline – ‘raising-the-bar’; the system is said to be above expectation.
This is the base of the algorithm and reviewed later in more details.
For each action or task, a single or a set of performance metric(s) is defined. The metrics need to be of tangibles types; intangible metrics are out of scope of this paper. The metrics are process-dependent. Examples of tangibles metrics, not all inclusive, are:
- Quality
- Percentages
- Error count
- Time
- Cost
- Quantity produced
- Revenue ($)
- Number of resources
- Etc.
It highly recommended that the metric values selected are numerical and positive integers between, 0 (included) and +∞. While there are metrics such as temperature which would inherently include negative values in the Celsius and Fahrenheit scales, this can be solved by using the Kelvin scale instead which has only positive values.
There are two types of ‘improvement’ metrics values to consider:
- Ascending values where the improvement is expressed in ascending fashion (0 to +∞) (e.g. revenue in $).
- Descending values where the improvement is expressed in descending fashion (+∞ to 0) (e.g. cost of producing a ‘widget’).
Depending on the application, the improvement metric value may be ascending or descending. This characteristic must be defined during the metric selection process.
For discussion purposes, the process is already established and is in the ‘Implemented Phase’ and its performance metrics and associated parameters have already been selected.
In the proposed CPI algorithm there are actually two negative feedback loops: a) one controlling the process and/or task; b) the other controlling the ‘Reference’.
The Figure 2, below, represents the model diagram of the proposed CPI algorithm.
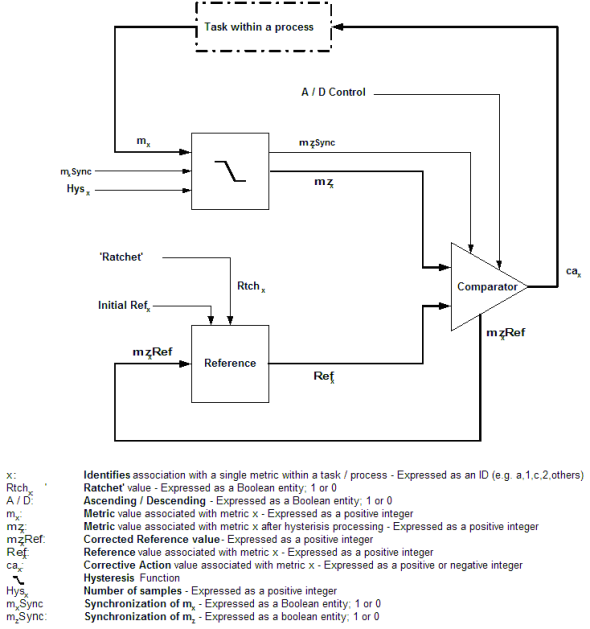
This block is addressed in Figure 1. While several improvement metrics can be associated with a single task, for simplicity, only a single metric is shown. Figure 2 shows the CPI model of a single metric.
If one sample is sufficient (simplest CPI process) then the equation become
The Reference is the desired value of performance associated with a given metric. The task performance metric is measured against this reference to make a decision if improvement to the process and/or task is required.
It should be noted that the control variables of this CPI process is out of the scope of this paper. The processing of these variables are very much application dependent. Since the algorithm proposed here addresses a single performance metric, the implementation of CPI for an entire process including multiple tasks and performance metrics would be best controlled by a state machine. The variables in questions are:
- A / D Control: Ascending / Descending improvement metrics set-up
- mxSync: Performance metric poling synchronization
- Hysx: Hysteresis control (i.e. number of sample to process)
- Rtchx: Ratchet value
- Initial Refx: Initial Reference; baseline
The proposed CPI solution can be implemented in software or firmware; though in many applications it would be embedded in the process application itself or in a remote operation center system. However in other means like pencil and paper or spreadsheets will also do!
CPI stands for ‘Continuous’ ‘Performance’ ‘Improvement’. A ‘Process’ is usually recursive and its life cycle can be very long such as financial, economic, or relatively short such as industrial, manufacturing, Information Technology (IT) operation centers applications, etc.
Regardless of the life cycle time, in almost all cases, the end goal is to provide better quality products at the least cost to produce them. In order do achieve this, a process must be ‘Continuously’ monitored and ‘Improved’ in time. The improvement implies that the reference that we are measuring the process against must also change – Raising the Bar – as improvement occurs. By definition, this can only be done by ‘feedback’ mechanisms as shown in this paper.
