Equipping employees with the right tools for their job is fundamental to achieving consistent results. Operational optimization and digital transformation initiatives at industrial processing plants depend heavily on supporting technologies to help teams achieve success. However, in the quest to attain top plantwide control performance, it is crucial to consider the corporate culture and the human aspects of these endeavors.
At leading processing companies, the engineering and management teams recognize this challenge and work to improve business and process optimization by carefully integrating technology with the workforce. For example, as part of a broader digital transformation initiative, many companies are already incorporating various advanced process analytics into their work processes. Those seeking maximum value are then building on these capabilities with deployments and workflows that engage all levels of personnel, from the plant floor through to upper management. This approach yields increased efficiency and profitability while enhancing employee enthusiasm, knowledge and capabilities.
Analyzing performance
At many large enterprises, some unit operations and processes vary widely in age of installation. Some sites are better equipped to pursue more improvements compared to others; however, the oldest sites often stand the most to gain from even simple improvements. Control Station’s control loop performance monitoring (CLPM) solution, PlantESP, is designed to support all types of operations, regardless of age, size or complexity. Its core capabilities enable stabilizing loop performance for individual units while the more advanced features allow for standardizing improvements plantwide or across the enterprise.
Process plant personnel can use many forms of analytics to great advantage as they seek to optimize individual equipment or production lines and multiply gains throughout the enterprise. Basic PID tuning software supports the important first steps of achieving optimal performance for individual regulatory control loops. However, the more extensive analytics offered by a complete CLPM solution provides greater capabilities, broadening the investigative scope to instrumentation, equipment, complete processing lines, or even the entire facility.
With CLPM, users gain access to detailed analytics and forensics tools, like spectral analysis and cross correlation (Figure 1). These features help them discover which loops may share similar problematic behaviors, and then trace out the potential root causes. In addition, users can investigate individual loops or compare like assets at one site or across many similar sites. They can also choose one or more key performance indicators (KPIs) that make the most sense for their business, providing a clear way to quantify, compare and understand individual loop and overall plant performance.
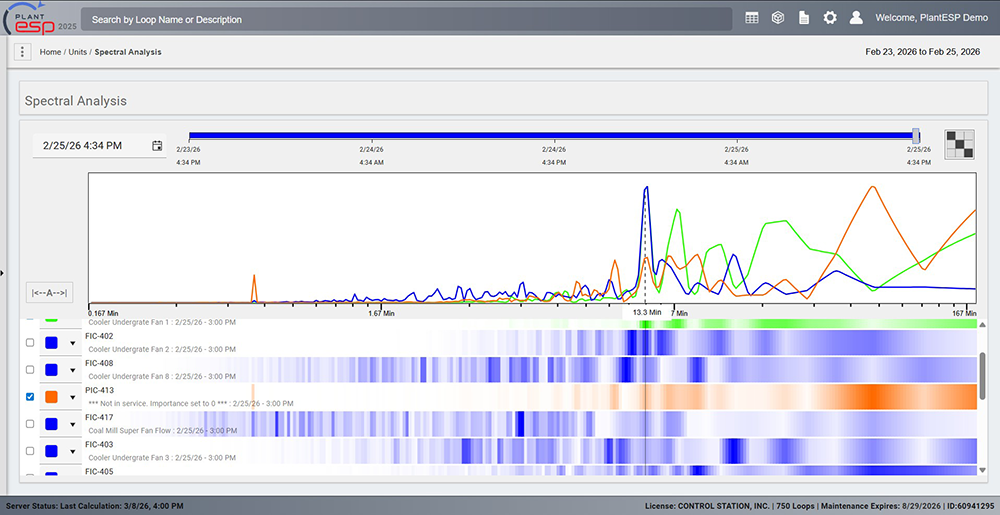 Figure 1: Modern CLPM software is about much more than individual process control loop tuning. Advanced analytics included with Control Station’s PlantESP, like spectral analysis (shown here) and cross correlation, help users investigate problematic loops and discover root causes of undesirable operation
Understanding overall controller effectiveness
One important KPI for process plants, introduced by Control Station via PlantESP, is overall controller effectiveness (OCE) (Figure 2). The OCE metric is similar to overall equipment effectiveness (OEE), which is universally accepted as a measure of discrete manufacturing performance. Like OEE, which is a composite value formulated based on availability, performance and quality, OCE is tailored to process control performance — by quantifying running time in normal mode, controller output (CO) running within the designed range and process variable (PV) operating near setpoint (SP).
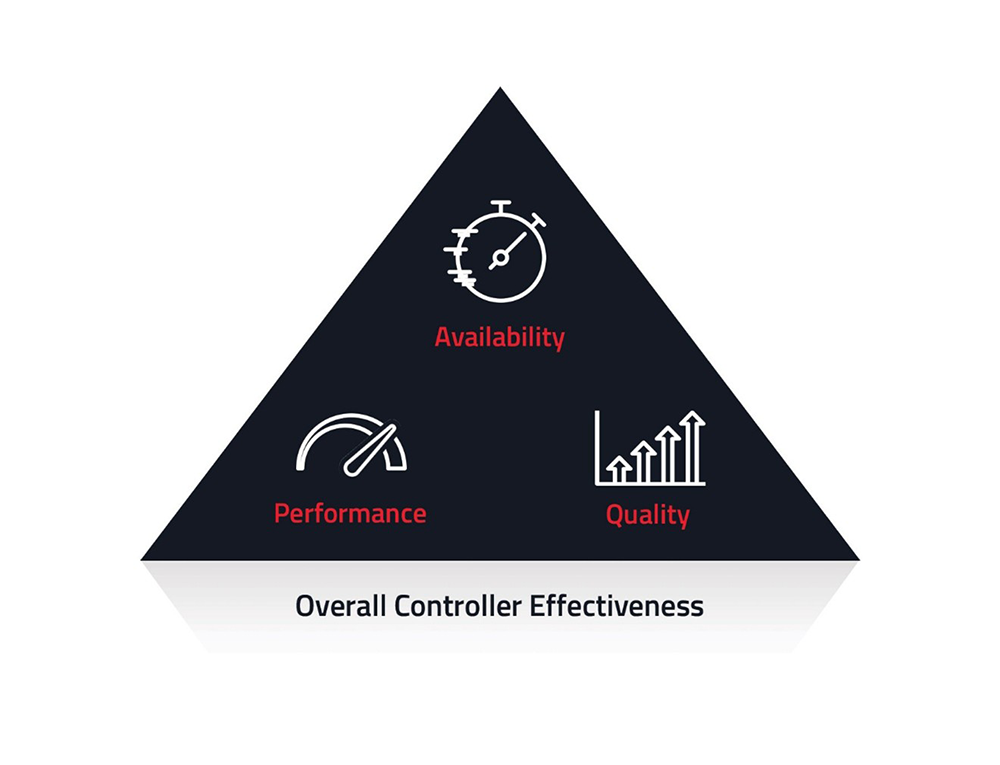 Figure 2: The Overall Controller Effectiveness (OCE) metric Control Station has developed for process control is like OEE for discrete manufacturing, providing a simplified measurement quantifying running time in normal (availability), controller output running within the designed range (performance) and process variable operating near setpoint (quality).
OCE identifies poor performing loops, especially those operating worse than comparably similar loops, which then become prime targets for investigation and improvement. Sometimes a loop is taken out of its desired mode due to being interlocked, or perhaps because of the operational team’s lack of confidence in its performance. Other times a CO winds up in an attempt to overcome some process issue, or poor tuning leads to a consistent mismatch between PV and SP. With OCE, teams can quickly spot these types of performance outliers and correct them.
The OCE metric can be considered for individual loops, or many can be aggregated to reflect the performance of all loops within an operating unit, a single plant or even across the enterprise. While operators and maintenance personnel are most familiar with standard PID metrics, OCE provides an intuitive “at a glance” view — valuable for these workers and their supervisors, along with management and corporate executives — so they can periodically gauge performance and direct optimization efforts strategically (Figure 3).
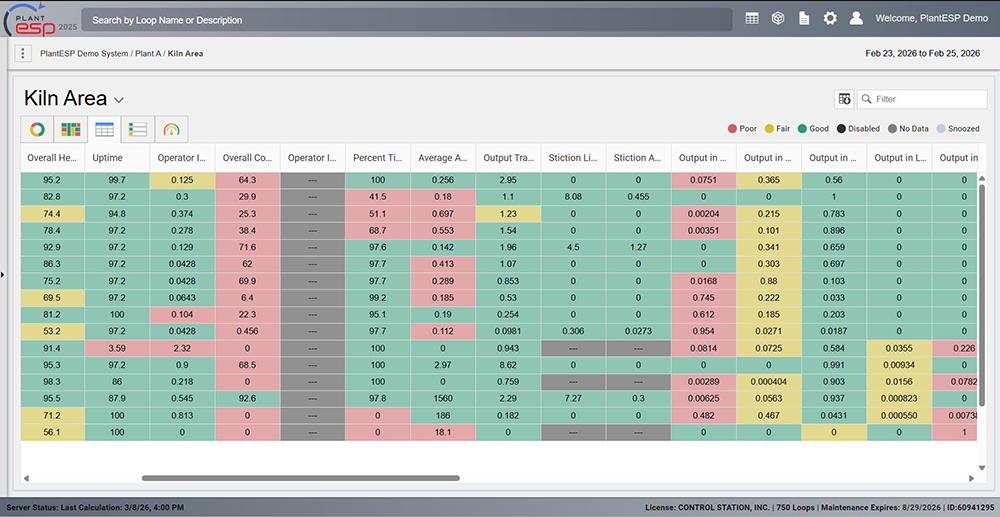
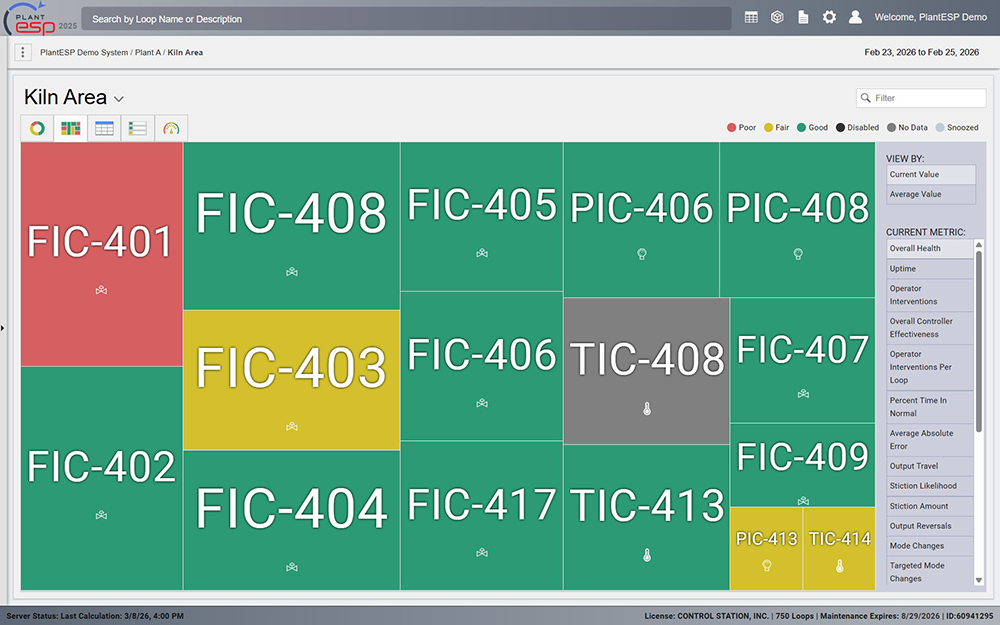 Figure 3: With advanced metrics like OCE and other visualization tools, Control Station CLPM software helps operators, engineers and management understand where performance is suboptimal, and how to improve it.
While the benefits of advanced regulatory control loop analytics and PID tuning software are evident for some users focused primarily on optimal control, a comprehensive CLPM solution provides more capabilities to a broader base of end users.
A user-centric deployment
As users gain experience with CLPM, they can leverage the analytical and tuning capabilities thereof. Furthermore, they can use REST API connectivity to easily integrate relevant PlantESP metrics into visualization tools used throughout their enterprise. By doing so, successful learnings are proceduralized into best practices to amplify results. This technology drives cultural change, and the entire organization stands to benefit.
Using the REST API, teams can integrate PlantESP KPIs into existing corporate intelligence dashboards, such as Power BI. This provides visibility to plant staff and corporate executives alike, with timely and relevant insights into plant performance, fostering a standard “performance dialogue” across the organization. Visuals curated for a particular division or operating group tailor the user experience and facilitate increased acceptance and rapid responses.
Although a core team usually implements these improvement actions, the eventual goal is to realize decentralized ownership of the solution for daily use by relevant operational teams. To help drive adoption, companies should provide training for personnel and develop procedures and other documentation, such as troubleshooting guides, to efficiently distribute findings. Regular meetings, incorporating these tools at the department, site and leadership levels sustain this process optimization initiative.
Enhancing success
Companies are using PlantESP to provide a new data-driven approach and focused perspective for improving business performance and supporting employee effectiveness. Changing the work culture can be more challenging than just deploying technology in the field because people often resist change, and sometimes collaborating across different functional groups proves difficult. However, companies are discovering that engaging all participants in optimization efforts can provide valuable insights which, when implemented, leads to greater employee engagement.
CLPM software’s greatest value is discovered when it is incorporated in the organization’s process optimization culture. Although optimization deployments are often initiated at the enterprise level, each plant learns how to own their CLPM data, steering their teams toward proactively identifying opportunities and supporting troubleshooting and eventual resolution. By consistently displaying KPIs, over time it becomes possible to visualize trends and allows the team to respond accordingly. The result is that optimization initiatives snowball throughout the organization becoming more of an enterprise-wide optimization effort, driven by ongoing success and positive team feedback.
Images courtesy of Control Station