




The following discussion is part of an ongoing column called Ask the Automation Pros, authored by Greg McMillan, 2010 ISA Life Achievement Award recipient, industry consultant and author of numerous process control books and articles. Submit your questions to [email protected] with “Ask the Automation Pros” in the subject line. Browse previous questions and answers here. Past Q&A videos are also available on the ISA YouTube channel; you can view the playlist here.
Erik Cornelsen’s question
In a continuous-process manufacturing plant, in which data is cyclically recorded—for example, at every 0.5, 1 or 2 seconds—what interesting insights can we get from this large amount of historical data, and what are the main challenges to extracting value from it?
In order to ensure that useful data is available when there is a demand to use historical data (for example, in order to determine the cause of a process upset or trip), what are some of the considerations involved in setting configurable parameters in data historians?
Hunter Vegas’s response
Michel will cover the value of historical data and its many uses. I will focus more on setting up the data compression and the configuration of the system. Before getting into that discussion, it is worth taking a higher-level look at historians in general.
In my experience, most plants actually have multiple historian systems. Most control systems have a “short-term” historian integrated into the system that drives local historical trends and tends to capture higher speed, higher resolution data. Unfortunately, the control system storage is often limited to 1 or 2 months. In many cases, that data is only available on the control system itself, so the ability to access that data may be limited and even impossible for engineers and other technical staff.
Because most plants have several disparate sources of data, like other control systems, lab systems, and so on, they often employ a site historian that has the ability to pull historical data from all of these systems into a single repository. This information is much more easily accessed by technical staff, is retained for years and is more easily utilized by the many applications Michel mentions.
The challenge of this arrangement is the configuration of the data compression settings, because you now have two places to set the data compression and, depending on how the site historian data interface works, it is possible that the site data resolution may be limited by the control system data historian settings. Some site historians pull the data directly off the control system, so only the site historian data compression applies. Other site historians pull historical data out of the control system historian, so the control system data compression settings are first applied and then the site historian compression settings are applied on top of that. (In this case, the effective resolution and data speed of the site historian can never be better than the values set in the control system historian.)
Historian licensing costs have generally fallen, and most historian systems are licensed by historized tag, so the data compression settings do not impact that price. However, the data compression settings absolutely do impact the quantity of data stored. Very high-speed data acquisition or relatively tight resolution settings on a noisy signal can fill data storage servers quickly. Fortunately, the cost of storage has fallen, but it is not free, and most historians have a functional limit to how much data they can store and have immediately available. (Long-term stored data can be archived, but these files are not typically available unless they are “reloaded” back into the system.)
Setting suggestions
Each historian is different, but most points have a couple of different settings. These are:
Point type: Analog data, digital data and, sometimes, string/character data. Some systems let you choose “auto” and the system selects the type automatically.
Sample rate: The definition of this value may vary by system. Simple systems save values at a frequency dictated by the sample rate. Historians that employ compression algorithms will always sample at least one value at this rate regardless of the compression settings.
Sample compression (usually in engineering units [EU] but it can be percent of scale): For historians with sample compression, the system will only sample the data if the current value is greater than the previous sample plus compression or less than the previous sample minus compression.
Here are some suggested historian settings for a typical control system historian. Note the special cases at the end.
Point type: It is better to choose the proper data type rather than choose “auto” as that setting unnecessarily loads up the processor.
Sample rate: If the historian has no compression, set this to equal the scan time of the point. If the historian has compression, this value can be set to something much longer like once every 4 hours. (This ensures that the system at least gathers a point every so often.)
Sample compression: Unless there are requirements for very high-resolution data, 0.5% of scale is a decent default setting.
Points to historize: Most sites historize all input/output (I/O) as a minimum. Many add totalizers, controller modes and setpoints to that list.
Special cases:
- If historizing a totalizer, set the compression to no more than the unit of totalization. (The range of a totalizer will be very high, so 0.5% will be a very high number. If totalizing in gallons, set resolution to 1 gallon or less.)
- Some critical quality data will need very low compression values to obtain very high-quality data and to capture any out-of-specification excursions.
- It is often worthwhile to set vessel pressure data compression quite low to more accurately capture and quantify vessel relief events as they occur.
- Beware of the units of compression! Confusing EGU with percent can have bad consequences.
- Some pharma companies have been known to explicitly set historian data resolution to coarse to avoid having that data used as part of the quality record. I think this stance is changing in our data-driven world, but I have encountered this at some locations.
If the plant has a site-wide data historian, then those settings will typically be the same as listed above. Some sites set the sampling and compression values higher to reduce the overall data rate capture and extend the length of time the data can be instantly accessed. However, that data will lack the resolution of the system data and may be inadequate for some applications.
One final suggestion: Inherently noisy analog points tend to constantly trigger the compression values and capture excessive data. A slight increase in the process variable (PV) filter setting can resolve this issue without significantly impacting the quality of the information captured.
Michel Ruel’s response
Leveraging process data: From historical data to diagnostics, modeling and performance improvement
The increasing availability of high-resolution process data from historians, combined with advanced analytical tools embedded in modern process control systems and specialized software packages, provides significant opportunities to improve process performance, reliability and operational decision-making.
The cost of data storage has decreased substantially, making it increasingly practical to retain large volumes of high-resolution process data with limited or no compression. This represents an important advantage for advanced analytics. Some legacy systems, however, applied significant data compression or stored data at relatively low sampling rates, which can limit the effectiveness of more advanced diagnostic and modeling techniques.
The value of process data goes well beyond historical trending. When properly structured and analyzed, historian data can be transformed into performance indicators, diagnostic information, process models and predictive tools.
Performance monitoring and condition assessment
A wide range of performance indicators can be automatically calculated from process data.
Instrumentation: Transmitters and analyzers
The quality and availability of measurement signals can be continuously assessed through indicators such as:
- Measurement availability and bad-quality time
- Signal saturation and range violations
- Noise and signal variability
- Sensor drift
- Rate-of-change abnormalities
- Analyzer availability and validation status
- Communication failures and signal dropouts
These indicators can help distinguish between actual process variability and problems associated with the measurement system.
Final control elements
The performance of valves and other final control elements can also be evaluated using historical operating data:
- Valve saturation
- Valve travel distribution
- Valve reversals and excessive movement
- Stiction
- Dead band
- Poor or inappropriate sizing
- Excessive cycling
- Operating range and time spent near travel limits
- Relationship between valve position and process response
For example, repeated valve reversals or prolonged operation near a travel limit can provide an indication of a potential control or mechanical problem before it becomes evident through conventional maintenance practices.
Control loop performance
Control loop performance can be assessed using both statistical and dynamic indicators, including:
- Time spent in automatic, manual, cascade or other operating modes
- Time in saturation
- Setpoint tracking
- Integral absolute error (IAE)
- Overshoot and undershoot
- Rise and settling time
- Response time
- Variability of the controlled variable
- Operator interventions
- Oscillation and cyclic behavior
- Interaction between control loops
- Sensitivity to disturbances
- Controller output variability
These indicators can be used to identify poorly performing loops, prioritize maintenance activities and determine where retuning or control strategy improvements may provide the greatest benefit.
Process modeling
The same historical data can be used to develop process models at different levels of complexity. Depending on the application, models can be developed for:
- Process behavior and dynamic response
- Equipment performance
- Relationships between manipulated and controlled variables
- Alarm generation and propagation
- Operating conditions
- Energy and material balances
- Abnormal operating conditions
Both first-principles and data-driven approaches can be considered. Data-driven models can be particularly valuable when the underlying process is complex, nonlinear or difficult to model from first principles.
Historical data can also be used to identify correlations and interactions that may not be apparent when variables are analyzed individually.
Automated tracking and reporting
Many of these performance indicators can be calculated automatically and continuously. The results can be incorporated into real-time dashboards and automated reports that provide:
- Equipment and loop performance indicators
- Identification of abnormal behavior
- Performance trends
- Diagnostic information
- Alarm statistics
- Operator intervention statistics
- Identification of recurring problems
- Comparison between operating periods, products or production grades
This changes the traditional approach from periodic manual analysis to continuous performance monitoring.
From diagnostics to prediction
Once sufficient historical data is available, the analysis can move beyond detecting existing problems toward predicting future events. The data can be used to:
- Detect abnormal operating conditions
- Identify precursors to equipment or process failures
- Predict process disturbances
- Diagnose probable root causes
- Optimize operating conditions
- Predict process performance
- Support operator decision-making
This represents an important transition from reactive diagnostics to predictive process management.
Example: Predicting electric arc losses
A practical example comes from an electric arc furnace that experienced electric arc losses approximately three to four times per day. Process engineers had identified several potential causes, but they were unable to establish which process conditions were consistently associated with the event.
Because historical data was available from multiple sources—including process measurements, control loops, alarms and operator interventions—we were able to analyze the process conditions preceding each arc-loss event. Rather than examining individual variables independently, the available data was combined to identify patterns and combinations of conditions associated with the event.
Artificial intelligence (AI) and data-driven modeling techniques were then used to develop a predictive model. The model could identify the conditions associated with an impending arc loss approximately 3 minutes before the event occurred, with 78% success. A 3-minute prediction horizon was sufficient to enable the operator to intervene and take corrective action, thereby avoiding the arc loss.
This example illustrates an important principle: the value of AI is not necessarily in replacing existing control strategies. Rather, it can provide an additional analytical layer above the basic regulatory control system, using information from multiple sources to detect patterns that are difficult to identify using conventional control techniques.
From control to intelligent process supervision
Traditional process control is primarily concerned with maintaining process variables within their desired operating ranges. Advanced analytics and AI can provide additional layers of functionality:
- Regulatory control: Maintain process variables at their setpoints.
- Performance monitoring: Determine whether the control system and equipment are performing properly.
- Diagnostics: Identify abnormal behavior and potential causes.
- Predictive analytics: Identify conditions that may lead to future problems.
- Optimization: Determine better operating conditions.
- Advanced decision support: Provide operators and engineers with actionable information.
With current developments in AI, these analytical functions can increasingly operate in real time. The opportunity is therefore not simply to collect more process data. The objective is to transform the data already being generated by the plant into actionable information for monitoring, diagnosis, prediction, optimization and continuous process improvement. The process historian can consequently become much more than a data archive: it can serve as the foundation for an intelligent layer of process supervision built on top of the existing control system.
Peter Morgan’s response
Michel comprehensively describes the use of historical data in monitoring control system performance, understanding behaviors, improving performance and identifying issues with every control system component. From another perspective, Hunter’s response offers some good practices in setting up the data historian so that data is historized with the fidelity required for the intended use. Critical in setting up the data historian is the configuration of point parameters, so that when there is a need to access the data, data of the required fidelity (quantity and quality) is available to perform the required analysis. This is particularly important for post-upset root cause analysis and control system behavior assessment, as wishing you had the right data after the event isn’t helpful.
It is common practice that the information technology (IT) departments manage (and configure) the central data historian, so it should be established early on that the control system specialist has the opportunity to identify process and control system values of interest and choose historian point parameter values. Understanding how data is sampled and compressed for archival purposes aids the interpretation of data and gives the assurance that the data is reliable.
It is common (and good practice) that data is captured in two stages, first by “exception” and second by “compression.” Compression saves storage space, which, to the control specialist, might suggest the compromising of historical data. This does not need to be the case when point parameters are set to take account of known process/control loop dynamics.
Exception reporting
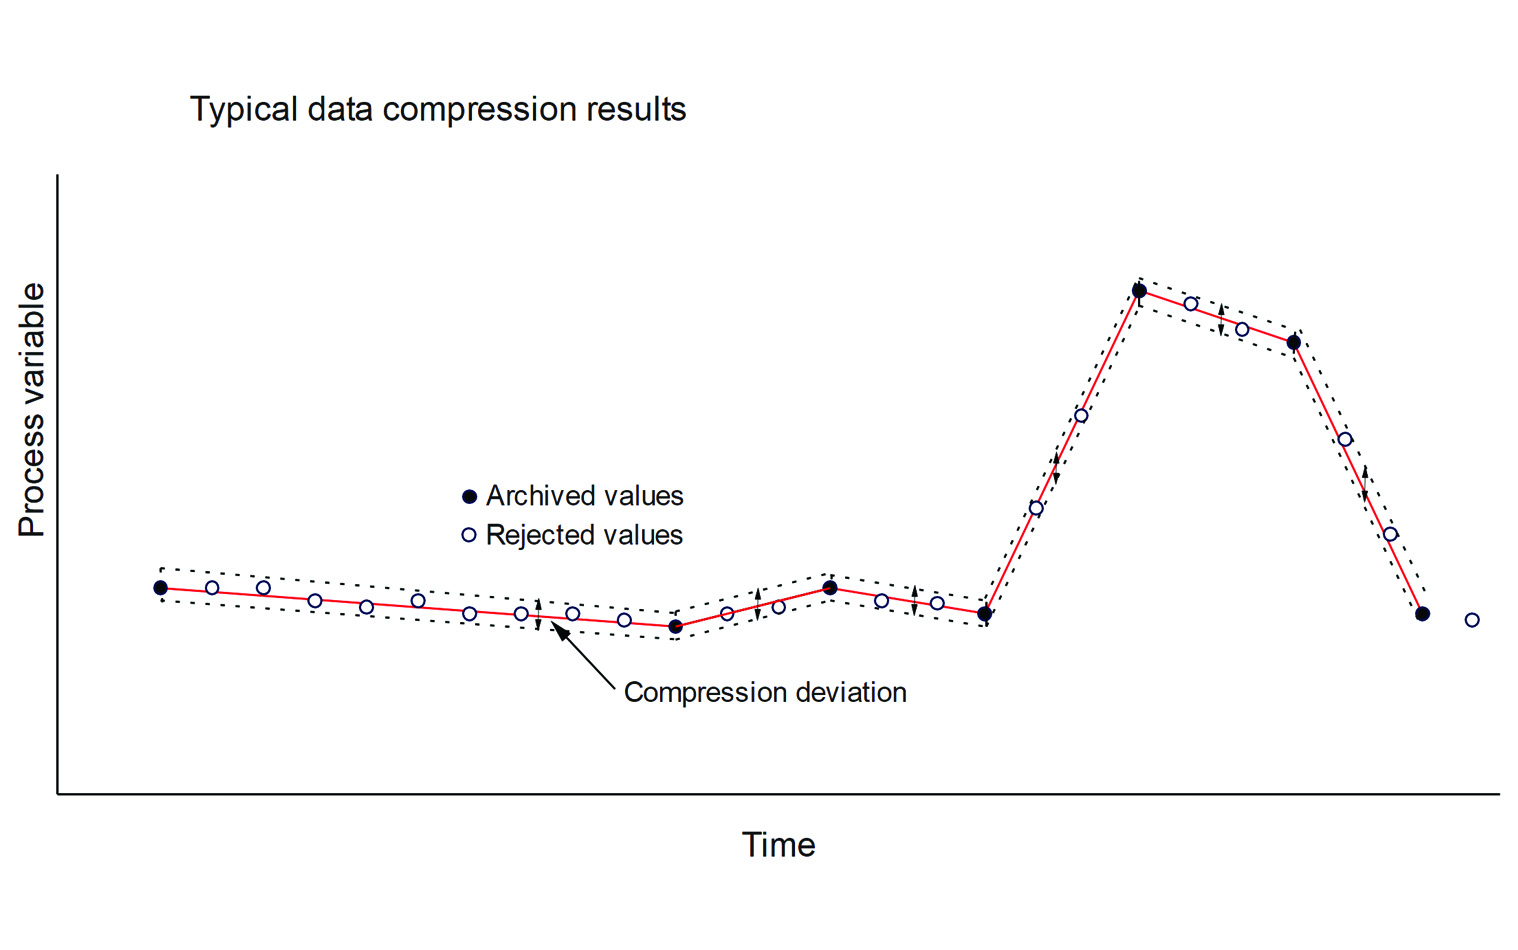
The historian reports values to the compression algorithm only when there is a change exceeding the configured exception deviation. For greater fidelity, the value previously captured is retained. Typically, the exception deviation (+/–) is set to match the instrument precision and, as such, is commonly referred to as a filter because it rejects values that would typically be classed as noise.
Compression
Values that pass the exception test are tested in the compression algorithm against the compression deviation setting. Compression differs from exception reporting in that the slope values are compared for each value passing the exception test so that raw values can be interpolated as lying within a parallelogram drawn between archived values, with a width twice that of the compression deviation. In other words, values can be assumed (with confidence) to lie along the line joining archived values +/– the compression deviation. The sketch included here should prove again that a picture is worth 1000 words.
Sampling rate
Not mentioned so far is the sampling interval for data reported to the historian from, for instance, the distributed control system (DCS). Data historians typically allow the sampling interval to be assigned by class, such as 1 second for fast sampling, so that the sampling interval for specific variables can be set based on known response time, process dead time, actuator rates and other factors. Practical limits typically dictate that fast sampling cannot be universally applied; therefore, judgment must be used in its application.
While the use of historical data can lead to real gains in control system performance as well as aid in identifying control strategy revisions to handle process conditions that may not have been previously identified, the most dramatic use of historized data in operating plants often follows a plant upset when the root cause of the upset must be identified and the operator actions must be justified. Fortunately, I have never found myself in a situation where the data didn’t support the action of the operator—an important ally of the control system engineer.
Greg McMillan’s response
The sample rate should be less than 10% of the dead time in order to identify dead time that is critical for control loop performance and, fortunately, easy to identify on trend plots. The controller outputs must be historized to diagnose final control element responses, providing alerts as to poor resolution and lost motion. Also, because changes in process operating conditions are moved from controlled variables to manipulated variables, developing process problems are often best first detected as changes in manipulated variables.
The Chemical Engineering Progress CEP November 2026 article “Process Troubleshooting; Why Small Issues Escalate into Major Failures” alerts us to how to make sure we do not dismiss small changes in critical process variables such as temperature, pressure drop and utility usage, with my qualification that these changes can show up in manipulated variables. These changes can be indicative of changes in equipment performance (e.g., fouling), catalyst activity and raw material and recycle stream compositions. These degradations must be identified before they escalate into bigger problems and cause poor process performance, even to the point of safety instrumented system (SIS) activation and shutdowns. Compression must not hide these small changes that can escalate. Also, the time period in data analysis must be extended to be much longer than commonly realized because the process problems may take days to increase noticeably. Also, the oscillation period for a loop with a near-integrating and true integrating response that has a controller gain that is too small or a reset time that is too short can have an oscillation period that is 40 or more times the loop dead time, which for distillation columns can translate to days to recognize the oscillation.
Key performance indicators (KPIs) and real-time accounting (RTA) can provide alerts as to changes in process efficiency and capacity, as detailed in Section 11.10, “Virtual Plant and Online Process Metrics,” in the Process/Industrial Instruments and Controls Handbook, Sixth Edition, published by McGraw-Hill in 2019. Most people don’t realize that all degradations in process performance can be categorized as a decrease in process efficiency and/or capacity.
Data historian use in batch applications is even more challenging because there is no steady state. The May 2010 Control Talk Column by Brian Hrankowsky, “Drowning in Data, Starving for Information, 4,” provides considerable insights as to the challenges in batch operations. Obviously, problems can show up in batch cycle times and the end points or profiles of key batch process variables or in the case of control loops, the endpoints and profiles of manipulated variables. Parts 1, 2 and 3 of the Control Talk Column provide knowledge by Randy Reiss on the more intelligent use of data analytics.