Walk into a modern processing plant, and the floor hums with sensors. For example, a single bioreactor in a pharma facility can stream a few hundred tags. Add manufacturing execution system (MES) events, laboratory information management system (LIMS) results, process analytical technology (PAT) spectra and equipment health data, and a typical line generates more time-stamped information in a week than a continuous process verification (CPV) team can comfortably review in a year. And yet, when the annual product review comes around, most of these signals still end up frozen in a static report: summarized, archived and read once.
CPV is meant to be the part of the lifecycle where manufacturers learn from production data and act on what they see, but in practice, it often looks like retrospective reporting with a new label. Trend charts are built in spreadsheets, and cross-system joins are performed by hand. The problem is rarely a shortage of data; it is the gap between the data sitting in IIoT systems and the questions a CPV engineer needs to answer during their workday.
Closing that gap is at the heart of digital transformation. Done well, it turns real-time monitoring and analysis of production data from a compliance task into a working feedback loop, and it lays a data foundation that pays back across operations, quality and engineering. This article describes what that looks like in practice.
Where traditional CPV runs out of road
The familiar pattern is hard to miss. Critical quality attributes are trended in isolation over short windows, and reviews are periodic and retrospective, so deviations are noticed long after the events or decisions that caused them. Pulling data together from the historian, MES, LIMS, PAT and quality system is a manual exercise, with each carrying its own identifiers and quirks.
Automation can take the edge off some of this, but it often comes at a price. Once a report template is locked down, adding a variable, changing the baseline, or pulling in a new source can mean rebuilding the entire entity, and flexibility and rigor end up fighting for the same budget.
The deeper issue is structural. Most facilities are not short on signals, but on a coherent, use-case-driven data model that enables those signals to be joined quickly for the questions that CPV teams actually want to ask.
Designing the IIoT backbone around the questions you ask
Instead of beginning with cataloging tags, it can be useful to instead start at the other end, by first writing a few questions a process engineer would want to answer continuously. These tend to be variations of the same concept: are any critical quality attributes (CQAs) drifting toward the edge of the design space, even if they are still in spec? How does this batch compare to the cluster of golden batches we already trust? What was actually happening in the process during the deviation window we are now investigating?
Once those questions are visible, the data model almost designs itself.
Three entities sit at the center:
- Time is the universal coordinate
- Batch or lot is the unit of regulatory accountability and statistical analysis
- Product and process stage decide which critical process parameters (CPPs) and CQAs apply.
Around them, a small set of standardized keys do most of the work:
- A stable batch identifier that flows from MES into LIMS and historian records • A product or material code that enables grouping across batches, trains and sites
- Equipment and unit identifiers that anchor signals to the right part of the process
- Start and end times for every batch and unit operation
The aim is mundane but powerful. Any row of data—whether it comes from a lab system, a historian, or an event log—should be mappable to a product, a batch, a process stage and a time window without guesswork.
With that scaffolding in place, the cross-system joins that used to take days become routine. Historian and MES come together when batch start and end times segment continuous signals into batch-level slices, ready for statistics like means, peaks and profiles of critical process parameters. LIMS slots in when each result carries a batch identifier, letting assay, impurity and dissolution data join the corresponding capsule. PAT data, naturally time-stamped, links back through time and equipment to MES and historian sources, facilitating analysis of in-line measurements alongside conventional process tags. And event logs (alarms, operator interventions, change controls) can be batch-mapped so an investigation can overly what happened directly over signals and CQA trends.
Advance analytics and AI platforms, such as Seeq, sit on top of these sources and turn the keys into reusable building blocks: batch capsules, golden batch references and CPV views that engineers and scientists can explore directly (Figure 1).
 Figure 1: A validation data lifecycle evolution, from tabular compliance through analytics-integrated CPV.
From static reports to continuous CPV
Once the data model is activated, CPV starts to feel like a different kind of activity. The qualified ranges, control rules and process models that were defined during validation no longer must live in static documents and quarterly reviews, and they instead remain active in the background, applied to the live signal in real time. When a CPP drifts toward the edge of an acceptable range, a combination of parameters moves out of the validated envelope, or a model recognizes a pattern that has previously preceded an investigation, the system raises an event the moment the condition is met.
That shift turns CPV into a quality-by-exception operation. Most of the data behaves on most days, so the engineering effort spent on CPV is aimed squarely at the portion that does not. And because events are triggered at the parameter level while everything is still in spec, teams have a real chance to act before a marginal CPP turns into an out-of-spec CQA. The work, therefore, shifts from rebuilding context after the fact, to responding to live signals before they harden into quality events.
In an advanced analytics platform, this layered monitoring runs continuously. Batch capsules segment the time series as it streams in, while stored specifications and trained control rules are applied to each capsule as it completes. From there, lightweight statistical and pattern-based monitors feed dashboards and notifications to the people who need them, which provide a living view of the portfolio: batches across products and trains, exceptions surfaced where they matter, and drill-downs into the specific signals and unit operations behind any flag (Figure 2).
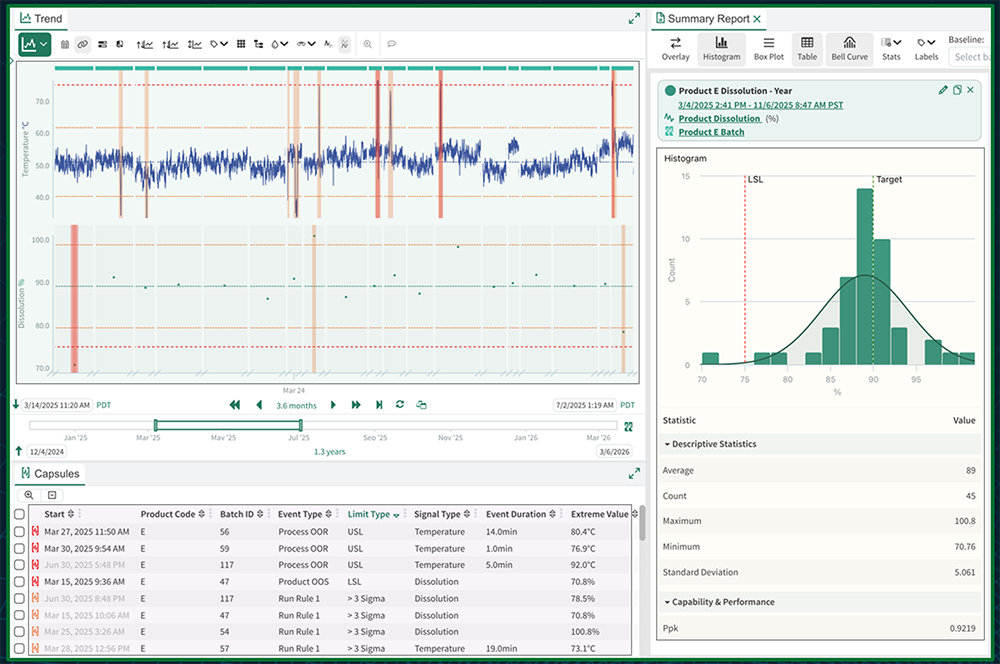 Figure 2: A CPV dashboard in Seeq showing process signals and CQAs, along with events and a statistical summary.
The cultural shift is the most essential element. When implemented smoothly, CPV transitions from a monthly or quarterly exercise tucked into the back of the quality calendar, into a daily activity embedded into how operators, analysts and engineers spend their time. As for the annual product review, the periodic CPV report, and the trend packages requested by inspectors—these still exist, but they become a side product of context that is already established, so their production is a continuation, instead of an activity requiring assembly from scratch.
Faster investigations, captured knowledge
The structures that support routine CPV also pay off when something goes wrong. When a deviation surfaces, engineers can move from the dashboard straight to the affected batch, pull up synchronized views of process data, lab results and event logs over the right time window, and build the investigation in a shared analytics workspace where charts, calculations, hypotheses and commentary all sit in the same place (Figure 3).
 Figure 3: An investigation workspace in Seeq, drilling from an out-of-trend CQA through related CPPs to a likely root cause.
Over time, those workspaces become a knowledge base and patterns emerge, providing analyses that build on each other. Investigations become faster, but the bigger gain is that the reasoning is preserved alongside the data and can be revisited later after memories fade.
CPV as a wedge for broader transformation
An analytics-integrated CPV program provides more than a regulatory tick; it quietly establishes a shared and trusted data foundation that the rest of the organization can build on. Advanced analytics and AI platforms’ batch-centric models empower engineers to compare scales, sites and trains using identical structures, easing operational optimization because batch performance and variability are properly quantified. Meanwhile, cycle time, yield and throughput improvements become directly attributable to known changes in process behavior and portfolio-level views of risk and opportunity emerge naturally with consistent CPV metrics and models across products and facilities.
For many companies, CPV provides the original business case for building this backbone. It is not a nice-to-have, but a regulatory expectation, and quality assurance provides a universally strong investment justification in process manufacturing. Once the infrastructure is in place, an analytics-integrated and decision-intelligent CPV program enhances operations, engineering and quality simultaneously.
The journey from periodic monitoring to genuine continuous improvement does not come by adding more charts to the annual report, but by reshaping how validation data is collected, structured and used. As a result, quality and performance insight is available when decisions are made, not months later. For manufacturers willing to architect their IIoT and analytics stack around this idea, CPV becomes a strategic asset, instead of a chore.
All figures courtesy of Seeq